What are pricing value maps?
Pricing value maps are visualization tools that marketers and consulting firms use to illustrate several linked points:
- Pricing strategy should ultimately be linked to “value,” as measured by the perception of consumers. More specifically, a buyer’s willingness-to-pay (WTP) is driven primarily by her perceived value (benefits) from buying and using the product.
- By “mapping” the offerings of a brand and those of its competitors against the dimensions of value and WTP, positioning insights can be derived that can aid the firm in:
- Better setting overall pricing strategy or specific price points
- Determining what existing / new products are relatively advantaged (or disadvantaged) vs. those of competitors
- War-gaming how to react when one or several competitors take pricing decisions or enter / exit with various new / obsolete products, thereby “altering” the map
The anatomy of a pricing value map
Let’s take a look at a typical value map and see how to read it. (You can see where this data comes from in the descriptions of each axis below.)
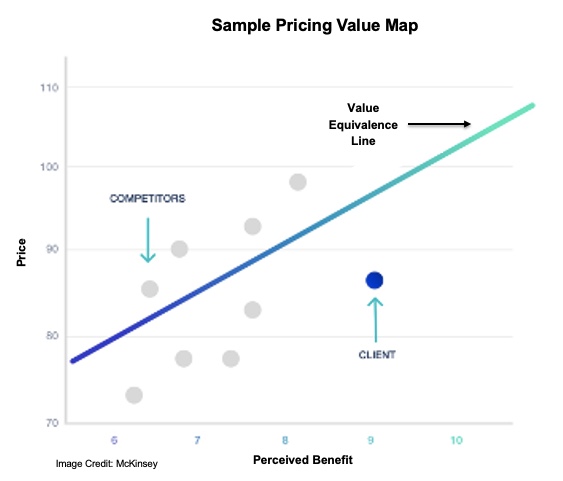
- The horizontal x-axis represents customers’ Perceived Benefit. It shows numerical values for each item’s perceived “value” in the minds of consumers. Companies can use surveys to derive these values from consumer scorecard responses about the importance of various product benefits and their perceived relative rating of each product on each benefit.
- The vertical y-axis is Price and shows known or actual prices for each item. Sometimes what data is available drives the choice of “which” prices to use (such as base price vs. average unit price for CPG). The pricing team must decide what is more informative for comparison and what dimension of price it can “standardize.” The best source for pricing data is actual POS data. Other sources used are online pricing scraped from retailer or manufacturer websites or consumer surveys.
- The diagonal line starting at the lower left and going towards the upper right is the Value Equivalence Line (VEL). This line shows the hypothetical “fair” trade-offs of price vs. value that best describe this category or group of products. In theory, if the measured Perceived Benefits and Price for each offering were correct and the market shares of competitors relatively stable then we would expect all offerings to lie on the VEL or really close to it. This would indicate that the market believes “you get what you pay for” with each offering. In practice this is rarely the case. Markets tend to deviate more from VEL when there is significant differentiation of offerings and benefits between competitors. The deviations get larger when more complex offerings and benefits are harder to “value” or efficiently communicate to consumers.
Interpretation
In the example above, the Client’s product is below and to the right of the VEL. This means that it lies in the “Value Advantaged” section – consumers pay less than the Benefits (or value) received would recommend as “fair” in the market. They are “getting more value for the money.” The distance from the VEL indicates a deeply value-advantaged position, which should command a higher price. Conversely, some of the competitors are above the VEL in the “Value Disadvantage” area. This suggests they offer poor value for the price relative to the market’s overall VEL .
What can you do with standard pricing value maps in CPG?
In CPG, value maps can be a table-stakes tool to enforce value-grounded thinking. This is critical for new product development, price-pack architecture decisions, and go-to-market (GTM) pricing considerations. One of the great benefits of value maps is that they funnel strategy towards a focus on benefits. They stress consumer’s perception of benefits, quantifying benefits, and solving for prices that can best harvest those benefits.
This analysis also creates a lead-in to take a “dynamic” view of the value proposition, recognizing it can evolve through market developments. As we know, consumer perceptions and behavior are constantly changing!
The typical value map can be useful as a table-stakes tool for strategy discussions. However, for CPG in particular it can benefit from CPG-specific adaptations and enhancements. In Part 2 of this post we will introduce an evolved CPG-friendly take on the value map. We then discuss the additional insights offered and how it can improve strategic and pricing decision-making.